Posted by: Pdfprep
Post Date: November 23, 2020
From the Home tab in Power BI Desktop, you click Enter Data and create a table named Sales that contains the following data.
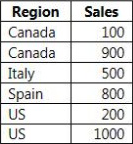
You add Region and Sales to a visualization and the visualization displays the following data.
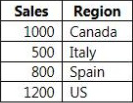
What causes the visualization to display four rows of data instead of six?
A . the Data Category of Region
B . the Default Summarization on Region
C . the Default Summarization on Sales
D . the Data Category of Sales
Answer: B
Leave a Reply