0 ITEMSView cart
Posted by: Pdfprep
Post Date: October 11, 2020
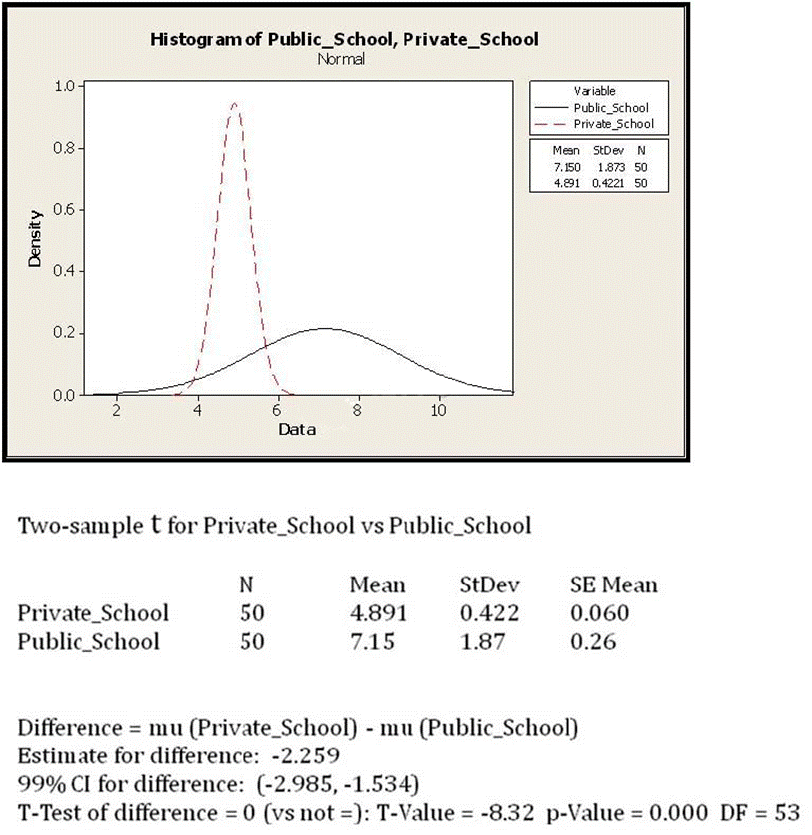
The class score distribution of schools in a metropolitan area is shown here along with an analysis output. Comment on the statistical significance between the Means of the two distributions. Select the most appropriate statement.

A . The two class Means are statistically different from each other
B . The two class Means statistically not different from each other
C . Inadequate information on class Means to make any statistical conclusions
D . A visual comparison shows that class Means are not statistically different
E . A visual comparison shows that class Means are statistically different
Answer: A
