Posted by: Pdfprep
Post Date: March 21, 2021
An analyst generates the following color-coded table shown in the exhibit to help explain the risk of potential incidents in the company. The vertical axis indicates the likelihood or an incident, while the horizontal axis indicates the impact.
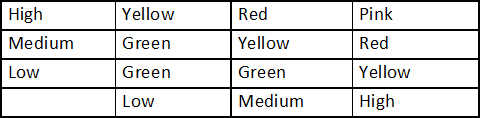
Which of the following is this table an example of?
A . Internal threat assessment
B . Privacy impact assessment
C . Qualitative risk assessment
D . Supply chain assessment
Answer: C
Leave a Reply