Posted by: Pdfprep
Post Date: November 22, 2020
Which statement(s) are true about the Fitted Line Plot shown here?
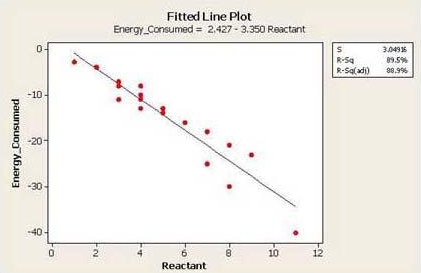
A . When Reactant increases, the Energy Consumed increases.
B . The predicted output Y is close to -18 when the Reactant level is set to 6.
C . Over 85 % of the variation of the Energy Consumed is explained by the Reactant via this Linear Regression.
D . Both b & c
Answer: D
Leave a Reply