You are creating a report in Power BI Desktop that has two visualizations on a page as shown in the following exhibit.
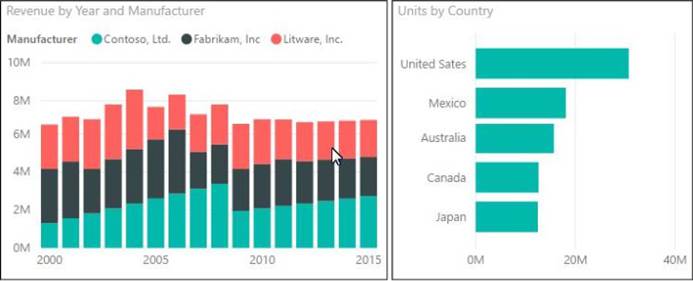
You need to ensure that when you click the bar of a country, only the values for that country are shown on the Revenue by Year and Manufacturer chart.
A . Click the Revenue by Year and Manufacturer chart. On the Format tab, click Edit Interactions. On the Units by Country chart, click Filter.
B . Click the Revenue by Year and Manufacturer chart. On the Format tab, click Edit Interactions. On the Units by Country chart, click Highlight.
C . Click the Units by Country chart. On the Format tab, click Edit Interactions. On the Revenue by Year and Manufacturer chart, click Filter.
D . Click the Units by Country chart. On the Format tab, click Edit Interactions. On the Revenue by Year and Manufacturer chart, click Highlight.
Answer: C
Explanation:
References:
https://docs.microsoft.com/en-us/power-bi/service-reports-visual-interactions
Leave a Reply