Posted by: Pdfprep
Post Date: October 26, 2020
HOTSPOT
You have a table that contains the following three columns:
– City
– Total Sales
– Occupation
You need to create a key influencers visualization as shown in the exhibit. (Click the Exhibit tab.)
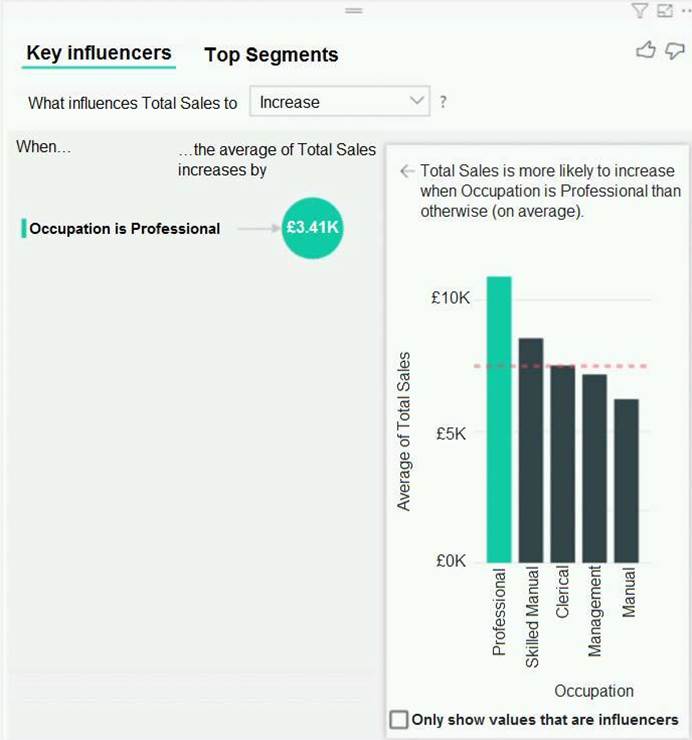
How should you configure the visualization? To answer, select the appropriate options in the answer area. NOTE: Each correct selection is worth one point.
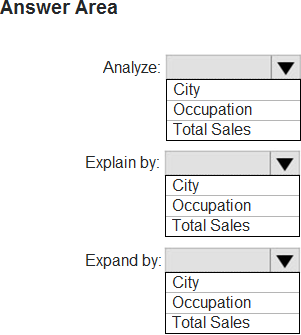
Answer: 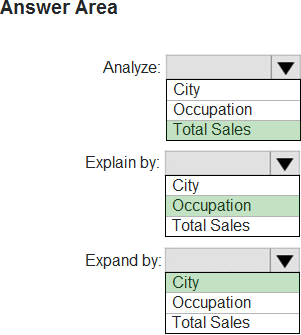
Explanation:
Box 1: Total Sales
Box 2: Occupation
Box 3: City
You can use Expand By to add fields you want to use for setting the level of the analysis without looking for new influencers.
Reference: https://docs.microsoft.com/en-us/power-bi/visuals/power-bi-visualization-influencers
Leave a Reply