You have the dataset shown in the following exhibit.
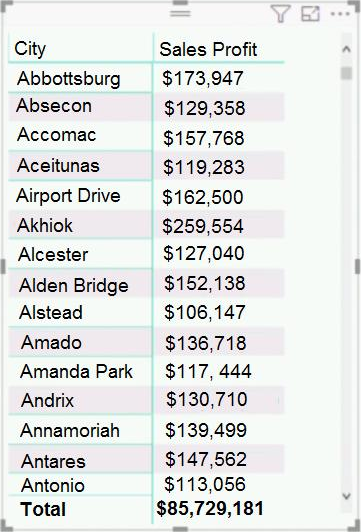
You need to ensure that the visual shows only the 10 cities that have the highest sales profit.
What should you do?
A . Add a Top N filter to the visual.
B . Configure the Sales Profit measure to use the RANKX function.
C . Add a calculated column to the table that uses the TOPN function. In the visual, replace Sales Profit with the calculated column.
D . Add a calculated column to the table that returns the city name if the city is in the top 10, otherwise the calculated column will return "Not in Top 10". In the visual, replace Sales Profit with the calculated column.
Answer: A
Explanation:
Power BI Top N Filters are useful to display the top performing records, and Bottom N filters are helpful to display the least performing records. For example, we can display top or bottom 10 products by orders or sales.
Note: https://www.tutorialgateway.org/power-bi-top-10-filters/
Leave a Reply