Posted by: Pdfprep
Post Date: December 8, 2020
Based on the following figure, during Iteration 5, there was an increase in story point value (shown on the graph); however, the team completed all of the work it promised to deliver in the iteration and existing estimates were not changed.
From this information, one can infer that:
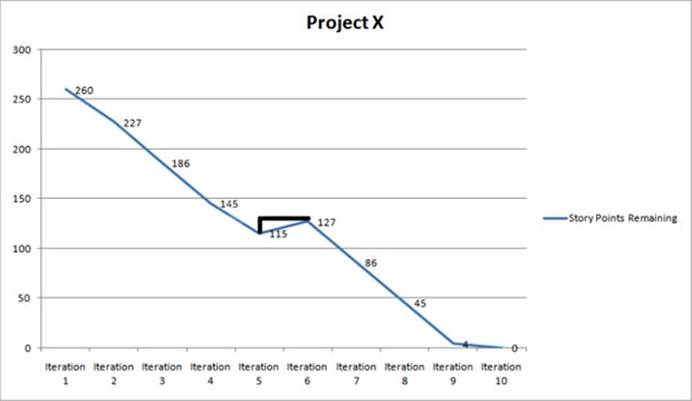
A . Work was removed from the Product Backlog.
B . Work was added to the Product Backlog.
C . The team’s velocity increased.
D . The team’s velocity decreased.
Answer: B
Leave a Reply